|
In iMath this week, we’ll be taking on the challenge of SLOPE by designing obstacle courses. On an 8.5” x 11” sheet of graph paper, make a full-color picture of an obstacle course. Frame it with a great, big coordinate plane. Your obstacle course needs to have at least four challenges on it. It needs to have at least four different slopes on it - one positive, one negative, one zero slope, and one slope that does not exist (DNE). Describe your obstacle course and calculate the slopes. 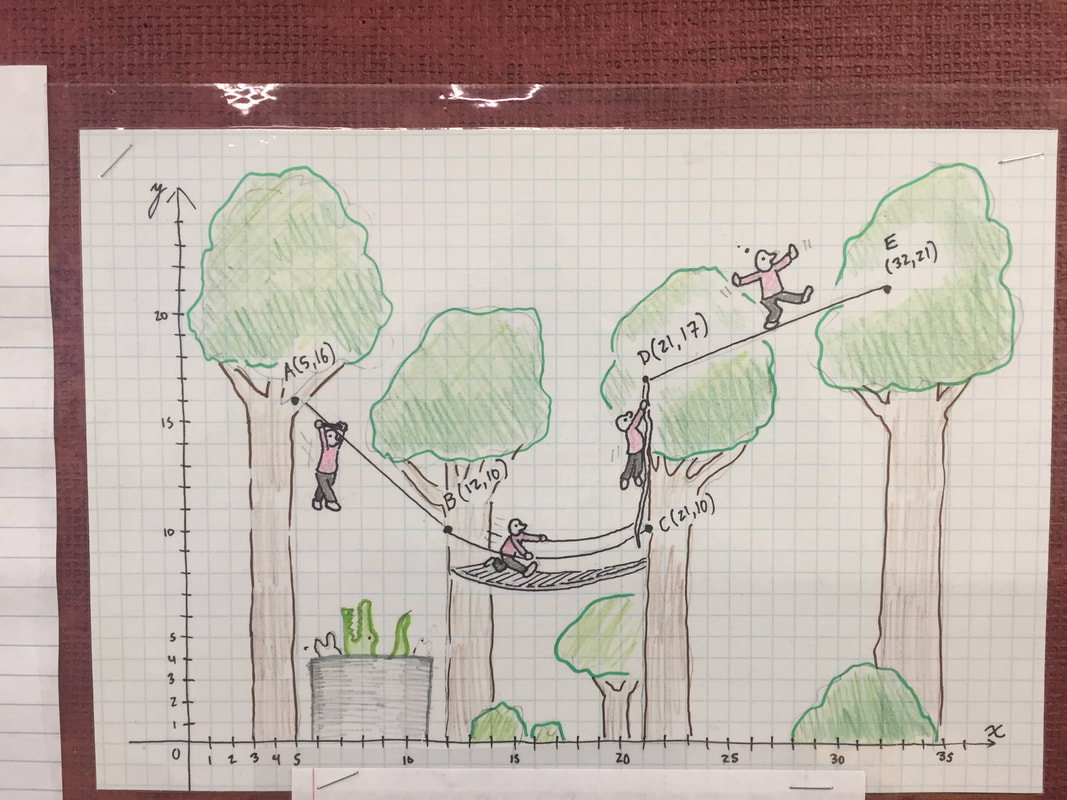 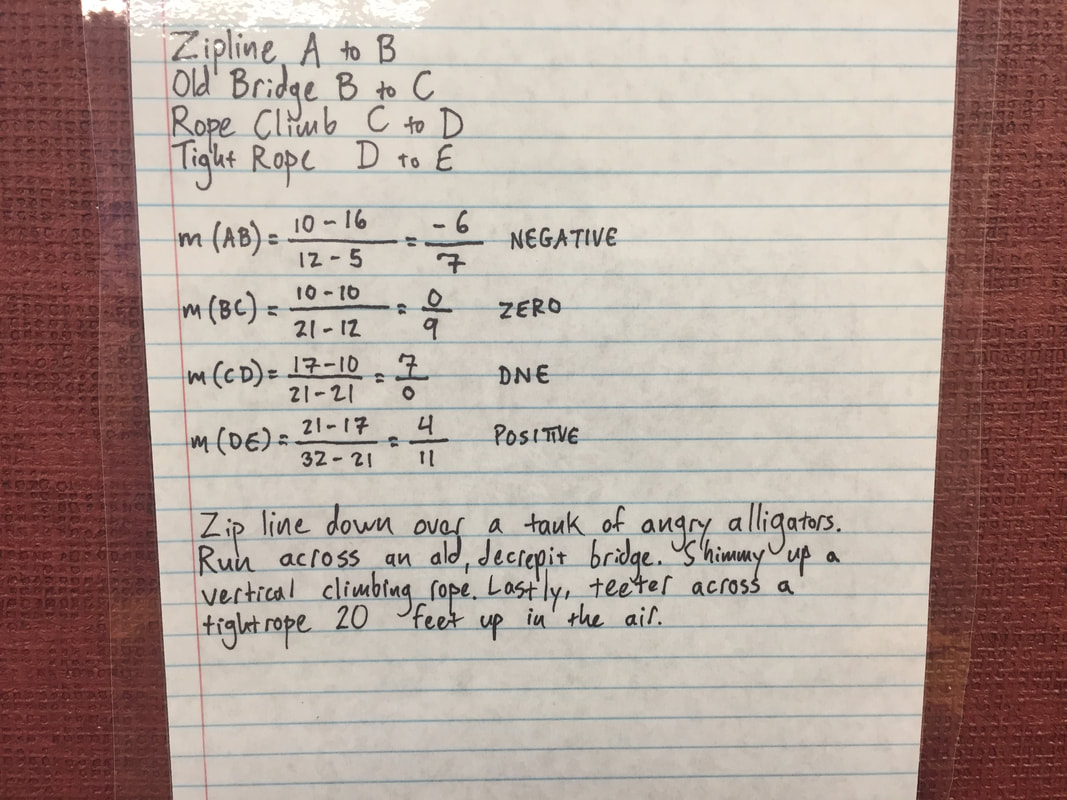
0 Comments
Last week in iMath we made surveys with four options (option one, option two, both, or neither) to make a Venn diagram. This week we are going to make a survey with six options to make a colorful, fun, interesting pie chart.
Students will need to complete _____ Survey _____ Computation _____ Title _____ Color _____ Interesting/Fun _____ Key _____ Percents _____ Labels _____ Critical Analysis _____ Background Information This week in iMath, you’re going to draw two pictures using the irrational number phi (1.61…). Mr. Deeble will guide you on how to make these pictures in class. The first drawing is a spiral. The next one is a person. 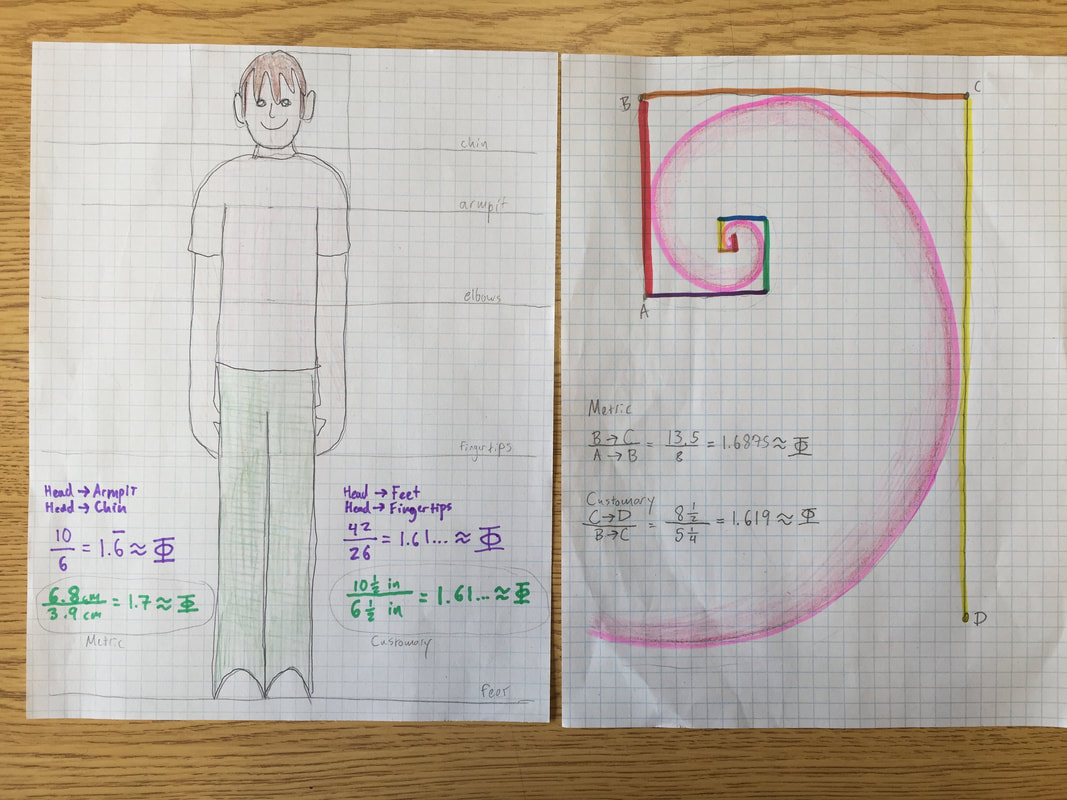 This week in iMath, we're creating games based on Candyland called Calculand. Students need to make a game board and a deck of playing cards. 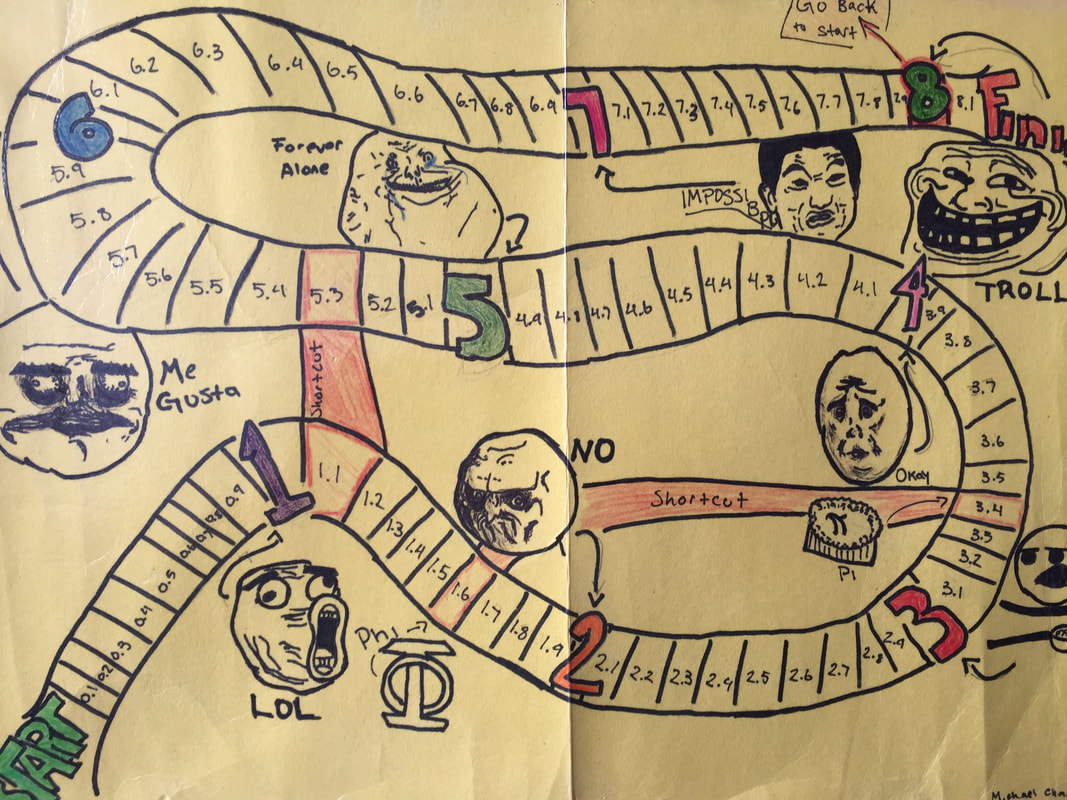 In the grid below, make a colorful castle of whatever shape and size you would like. It should be blocky and squarish to fit the grid. No triangles or circles unless you can calculate their area. You must include is a 2 x 2 box somewhere in your castle. This is the leader of your castle. We will attack each other’s castles in a geometric probability game. You can do an overhead view or a side view. 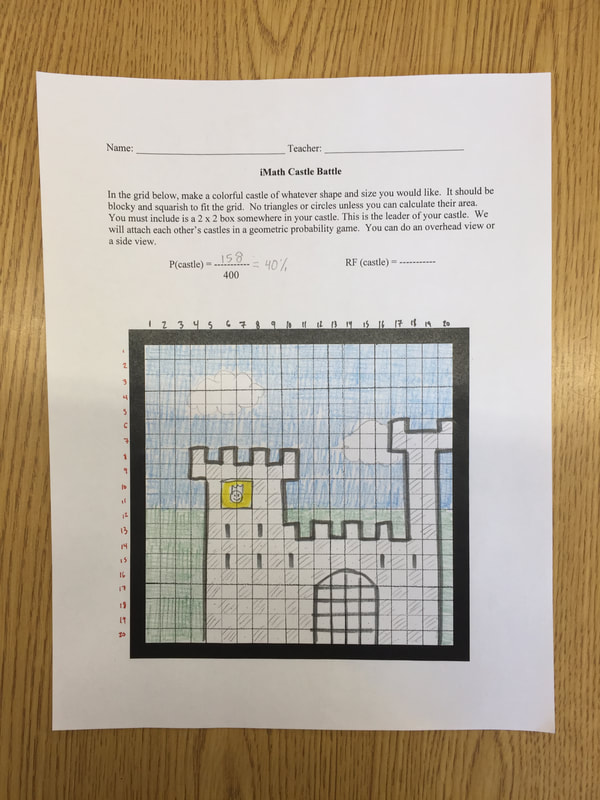 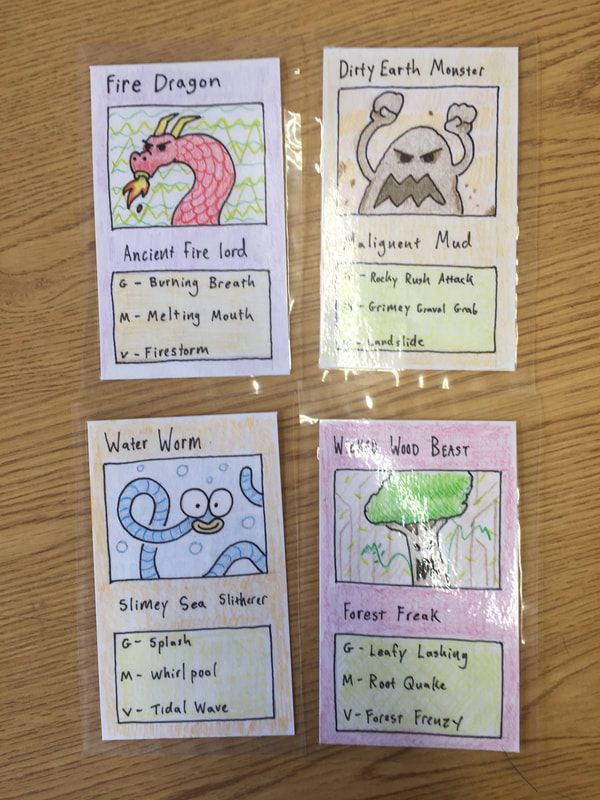 Due I CHOOSE YOU…to make 5 Probámon cards this week. Each card needs to have a creative name for your character, a picture, three attacks (a gentle, a medium, and a vicious attack), and a Probádex entry. Each card should be accompanied by a short, written description of the character. In short, there are seven things you need to do for each Probámon you create. You need to make 5 cards. There are a total of 35 things to hand in (i.e. 7 * 5 = 35).
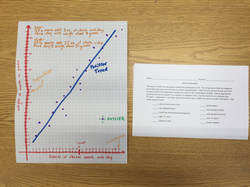 This week in iMath, we are going to study how scatterplots work. You are going to make an imaginary set of data with some sort of trend on a sheet of graph paper. Label the axes (plural of axis) and write on them which is the dependent variable and which is the independent variable. Add an appropriate trend line and write whether it is a positive or negative trend. Use the trend line to complete two “If…then…” statements – one high value and one low value. Make one point an outlier and label it. Add a little splash of color.
This week in iMath you will create an 8.5” x 11”, full-color drawing featuring at least one cone, one prism, one sphere, and one cylinder. Using the four volume formulas covered in class, you must find the individual volume for each shape and the total composite volume. Label the important distances on your picture and include a short written description or caption (i.e. “Sir Ryan,” said the king of pots, “you are a brave knight and I will assist you on your quest.”). 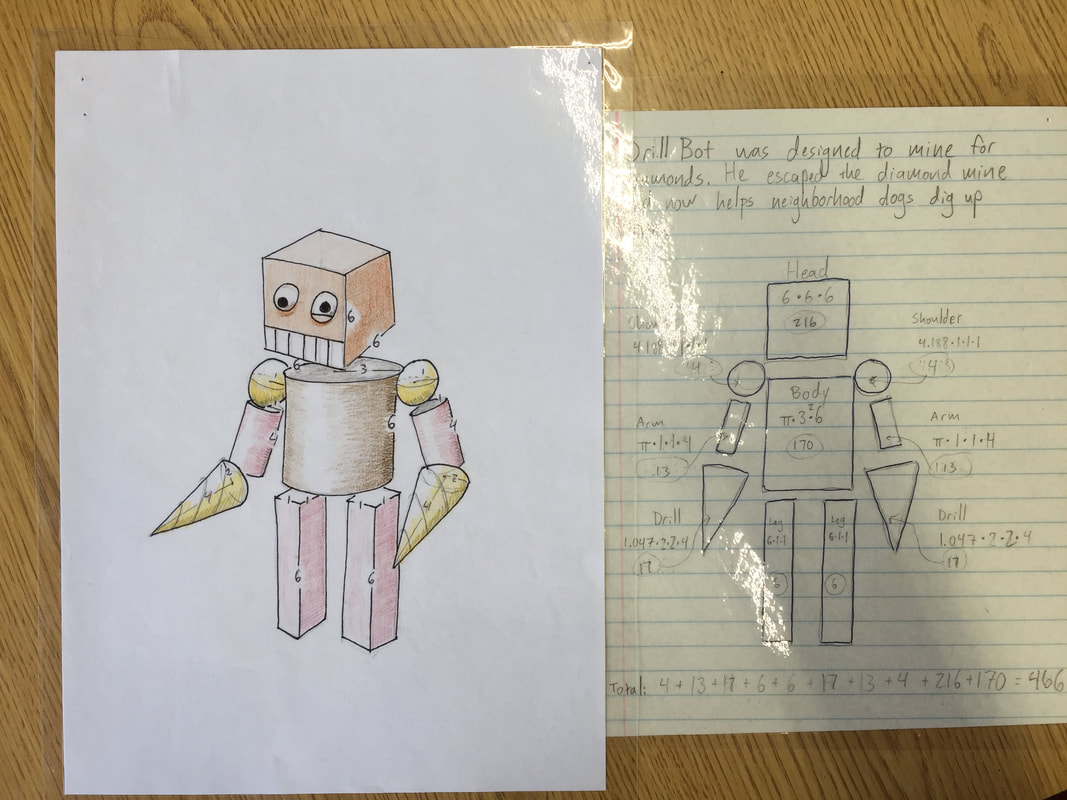 Harry Holtzman was an American artist who spent the latter part of his life in Lyme, CT. His version of American abstract art made extensive use of rectangles, prisms, and primary colors. Your assignment in iMath this week is to create a Harry Holtzman inspired piece of 3D sculpture using paper, tape, and straws. You must calculate the volume and surface area of the piece you make and include the nets for the rectangles. Google Harry Holtzman for inspiration. 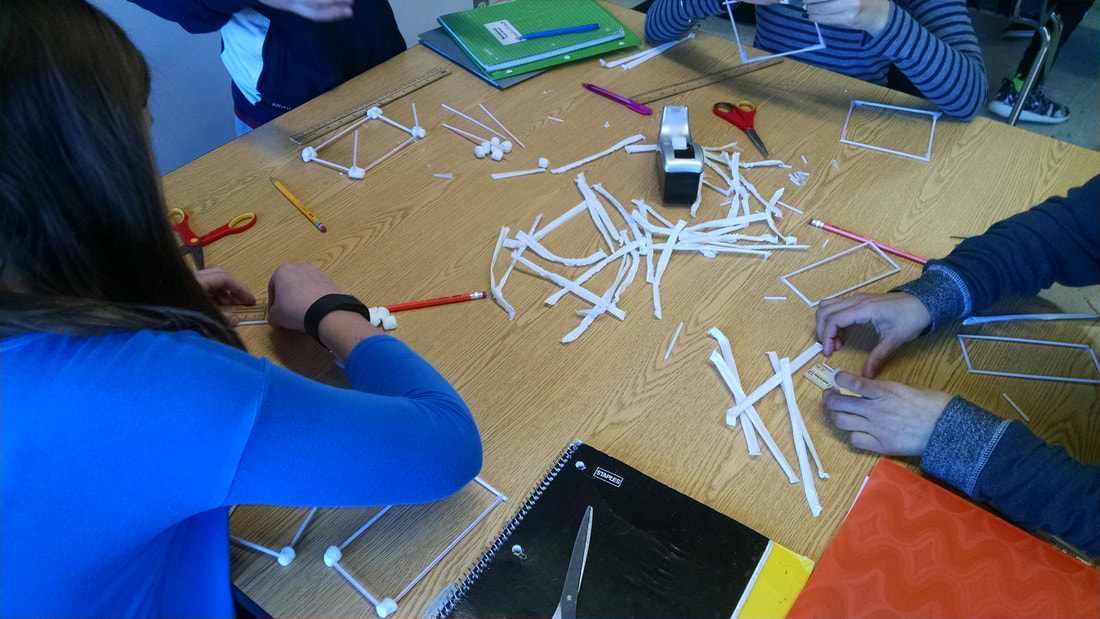 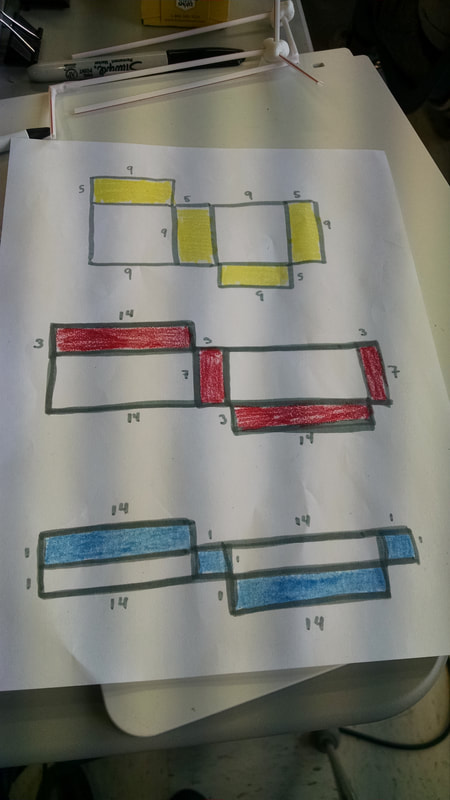 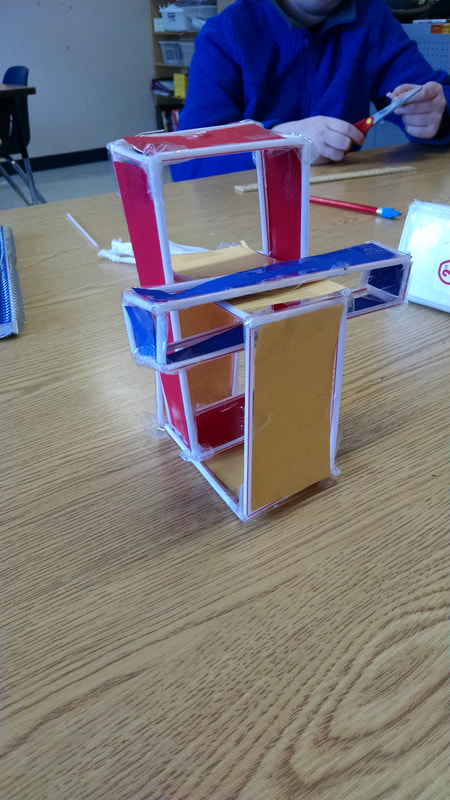 This is a short week in iMath. We’re going to talk about how to express 3D geometric figures as 2D geometric figures. Your assignment is to use isometric graph paper (dots) to draw out a detailed rectangular house. Then, you have to use graph paper to draw a flattened out net of that house. All the faces of the rectangular house must be the same dimensions on the graph paper and the isometric dots. 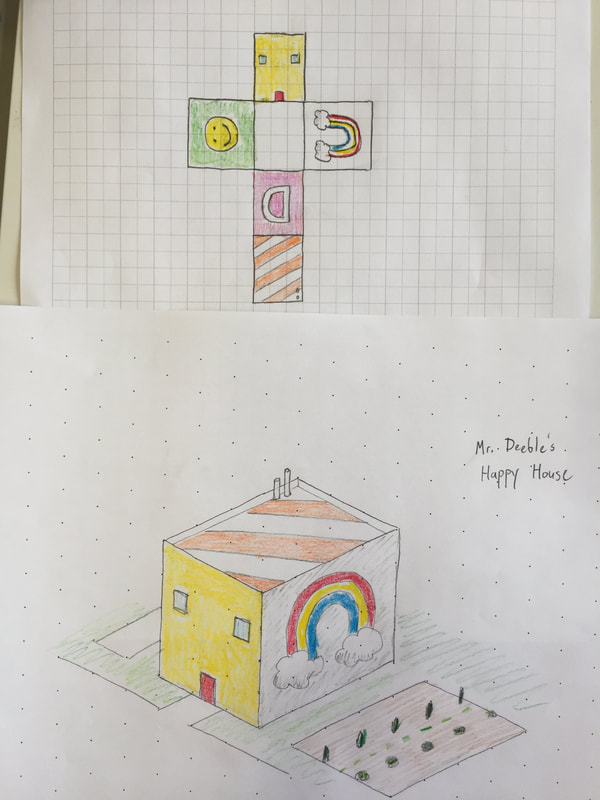 |
Mr. Jason DeebleArchives
November 2018
Categories |
 RSS Feed
