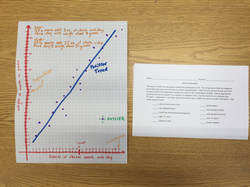
 This week in iMath, we are going to study how scatterplots work. You are going to make an imaginary set of data with some sort of trend on a sheet of graph paper. Label the axes (plural of axis) and write on them which is the dependent variable and which is the independent variable. Add an appropriate trend line and write whether it is a positive or negative trend. Use the trend line to complete two “If…then…” statements – one high value and one low value. Make one point an outlier and label it. Add a little splash of color.
0 Comments
Leave a Reply. |
Mr. Jason DeebleArchives
November 2018
Categories |
 RSS Feed
